
I love the 50-day Moving Average (MA) as a timing signal for my trading – because when a stock bounces off its 50-day MA, the move can be very powerful…
Like Astera Labs (Nasdaq: ALAB) last week:
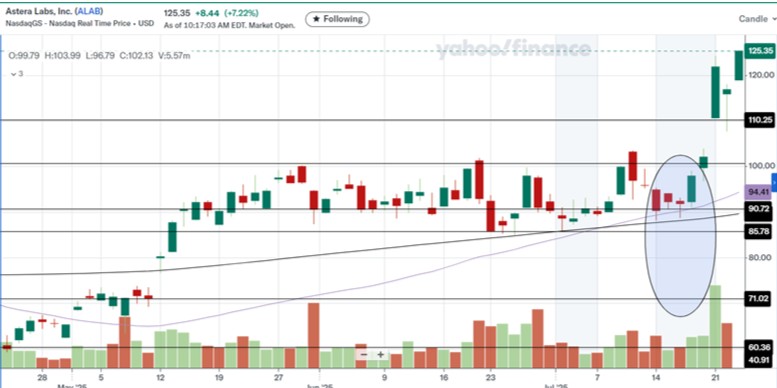
ALAB shares had been moving sideways between $90 and $100 since mid-May. Repeated attempts to breakout over $100 failed. The stock was locked in its channel, until the 50-day MA (purple line) caught up. It took a couple days, then the explosion in buying sent the stock from $90 to $120 in three days…
Now, clearly, every bounce off the 50-day MA isn’t going to get you a 30% run in three days. The point is: when a stock is consolidating or selling off, the 50-day MA is a very useful timing mechanism. And the great thing is, you don’t have to anticipate the move, or even be exact with your timing. You can wait for the move to prove itself, and then hop on for the ride!
What is the 50-Day Moving Average?
A moving average is a line created by averaging the closing price of a stock over a period of time. Each day, the oldest data point drops off and the new days data point (closing price) gets added. The result is a visual representation of the stock’s price trend…
Bigger picture, the 50-day MA is used as a proxy for the medium term trend of stocks and indexes. Above the 50-day MA, and the trend is up. Below it and it’s time to be careful…
The fact that a lot of traders and trading algorithms factor the 50-day MA into decision-making is what makes it useful.
So it might be helpful to think of the 50-day MA as a question that demands an answer. The question is: is the stock going higher or lower?
Now obviously, investors try to answer that question on every stock, every day. But when a stock price gets near its 50-day MA, the question takes on a certain urgency, because whether or not a stock is above or below its 50-day MA is an actual signal for buying and selling. (Why is the 50-day MA used as a signal and not the 40-day or 60-day MA? I don’t know and it doesn’t matter. Look, I don’t make up the rules around here, I’m just telling you what they are.)
Referring back to the ALAB chart you can practically hear traders asking the “higher or lower” question every day – some days the answer was “higher”, other days “lower.” The stock was free to bounce around, until the 50-day MA showed up and demanded a commitment. Again, I don’t make up the rules…
How a stock behaves around the 50-day MA is significant. Especially when a stock is sitting on its 50-day MA…that suggests that traders are a little uncertain – has the trend changed? Is the stock more likely to rally or sell off?
Here’s an example using Uber (Nasdaq: UBER)
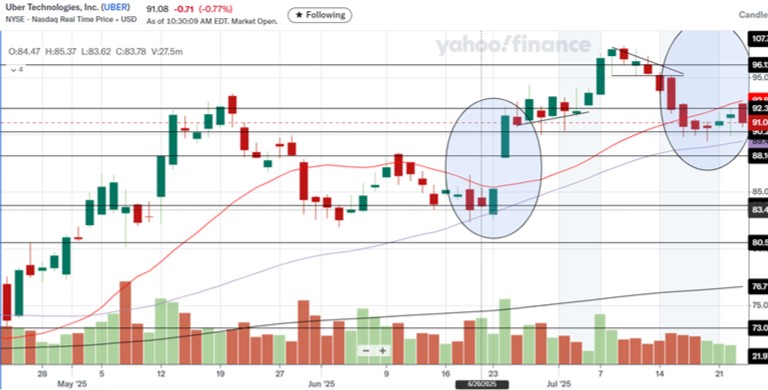
The 50-day MA is the rising purple line (the red line is the 21-day MA, which I use to inform daily trading decisions). In the first blue circle, you can see the UBER share price testing its 50-day MA in late June. The stock had rallied strongly into May, traders took profits and drove the stock lower until it encountered the 50-day MA…
You can see the indecision there. Had the medium term trend changed? Was this a buying opportunity? It took a couple days to reach a consensus – but once consensus was reached, the stock launched from $83 to $97 in virtually a straight line.
That exact same scenario is playing out right now, in the second blue circle.
UBER has sold off from those recent highs around $97. It hasn’t quite hit the 50-day MA – but it’s pretty obvious the stock price is responding to it. You can practically hear the questions about UBER’s trend – is robo-taxi a threat? Was that a top for the stock…?
The answer to those questions will emerge soon enough – and you’ll know when UBER makes a decisive move off that 50-day MA…
50-Day MAs to Watch (and Trade!)
Now I’d like to share a stock with you that might be on the verge of a nice move higher: Serve Robotics (Nasdaq: SERV).
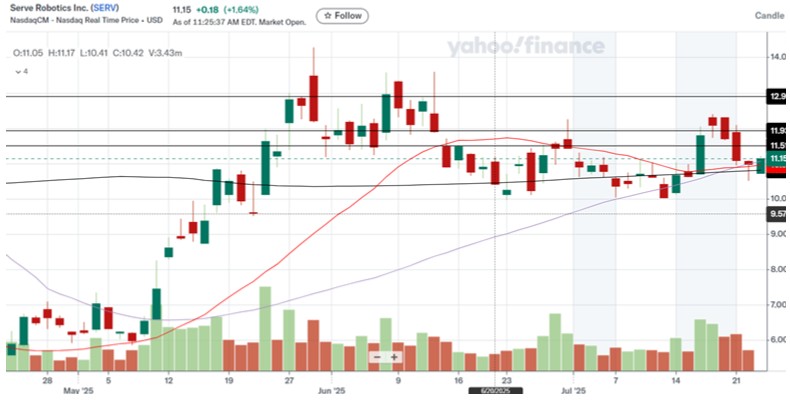
Serve Robotics makes rolling autonomous delivery robots, I guess you’d call them. They look like little coolers on wheels, and they are on city streets now. Serve was actually a spinoff from Uber and Uber still owns 12% of the company…
It is currently sitting on not one…not two…but three commonly used moving averages!
There’s the 50-day (purple line), 200-day (black line) and 21-day (red line). The same setup was in play last week, and SERV shares ramped from $10.60 to $12.30. Now the stock is back to testing all those MAs at once. The stock is trying to bounce off them again today. If successful, a 10% rally is likely…and it could be more…
Interestingly, SERV plans to have 2,000 of its automated delivery robots making deliveries for Uber Eats by the end of the year. Yes, the robots are coming…
Autonomous vehicles like Serve’s delivery robots and robo-taxis like the Waymo’s that run on the Uber platform are at the start of a huge bull market. I’ve got a few other investment ideas for this meg-bull market HERE.
Take care,
Briton Ryle
Chief Investment Strategist
Outsider Club
X/Twitter: https://twitter.com/BritonRyle